


The new generation
of intelligent portfolio analysis
AI-powered building analysis
through intelligent data structuring








The new generation
of intelligent portfolio analysis
AI-powered building analysis through intelligent data structuring
Intelligent building analysis with AI:
Expert-level CO₂ calculations
in 10% of the time

For real estate & portfolio managers
Efficient ESG analyses and risk assessments for strategically sound investment decisions.
Scientifically sound ESG analyses

For sustainability & ESG managers
Solid data foundation for ESG reporting and CO2 reduction disclosure requirements.
Reliable climate data for regional planning

For financial institutions & risk management
Assessment of ESG risks, taxonomy compliance, and portfolio transparency.
Active management of ESG risks
Almost every building type can be analyzed


Regulatory requirements:
of the buildings that need to be climate-neutral by 2045 are already standing today.

elevait ai:cm reduces ESG complexity for various decision-making roles
Detailed CO2 calculations at both the property and portfolio level
Building data is verified and enriched with validated geo-data
Rapid ESG reports for informed renovation strategies
Detailed CO2 calculations at the property and portfolio level
Support for EU Taxonomy and ESG disclosure requirements
Objective emission metrics for real estate portfolios
Objective emission metrics for real estate portfolios
Regional comparability and risk assessment
Support for EU Taxonomy and ESG disclosure requirements
Detailed CO2 calculations at the property and portfolio level
Identification of emission-intensive districts and building groups
Support for climate protection and funding programs
AI-powered features for sound ESG analysis
From unsorted data to meaningful ESG insights
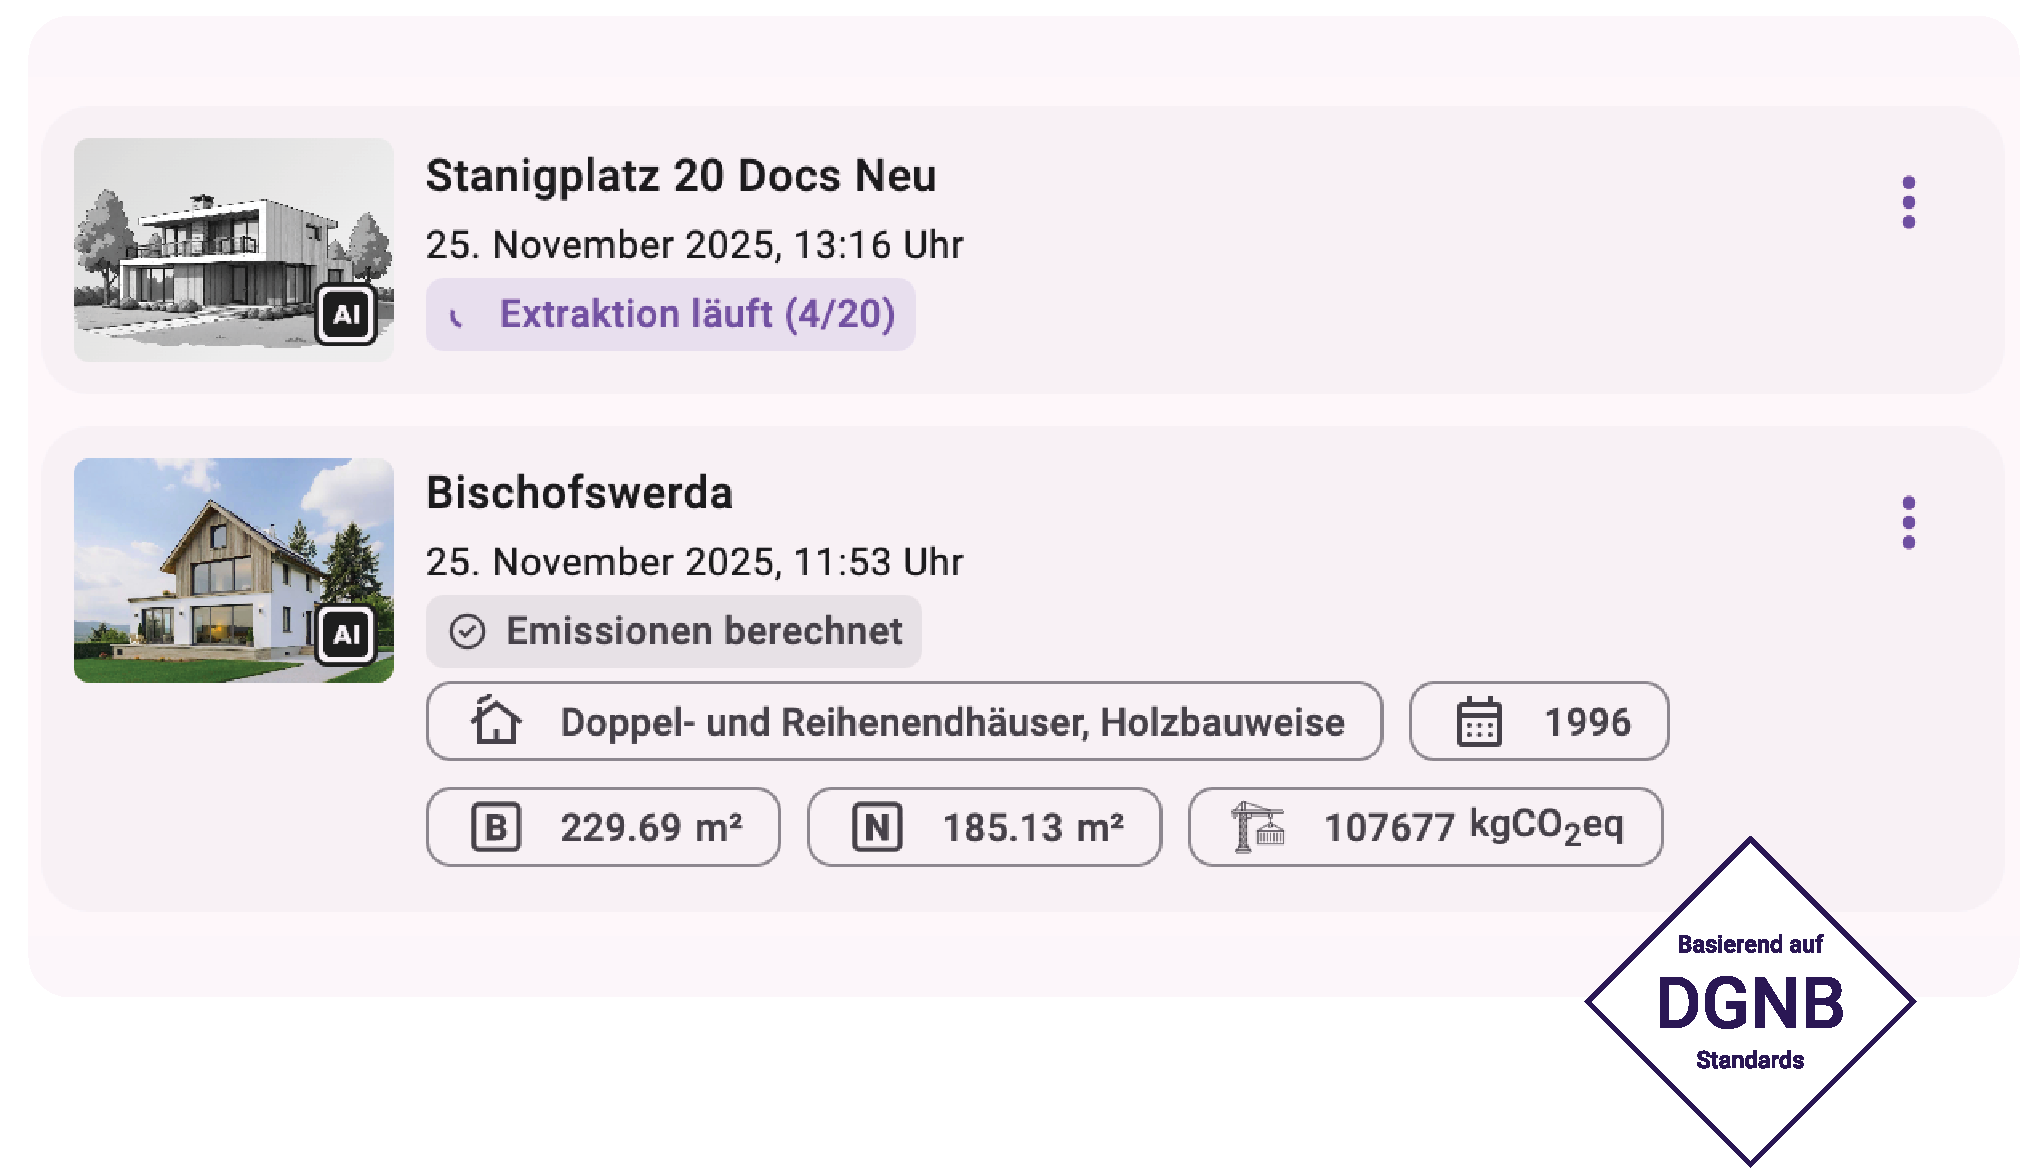
Upload
Documents such as energy bills, floor area calculations, and other building records are uploaded.
Automatic Classification & Data Collection
The AI identifies document types and extracts key values such as energy consumption, floor area, building type, year of construction, and address.
CO2 Calculation
The system calculates the operational carbon footprint based on consumption data and estimates embodied carbon from the construction phase using statistical models.
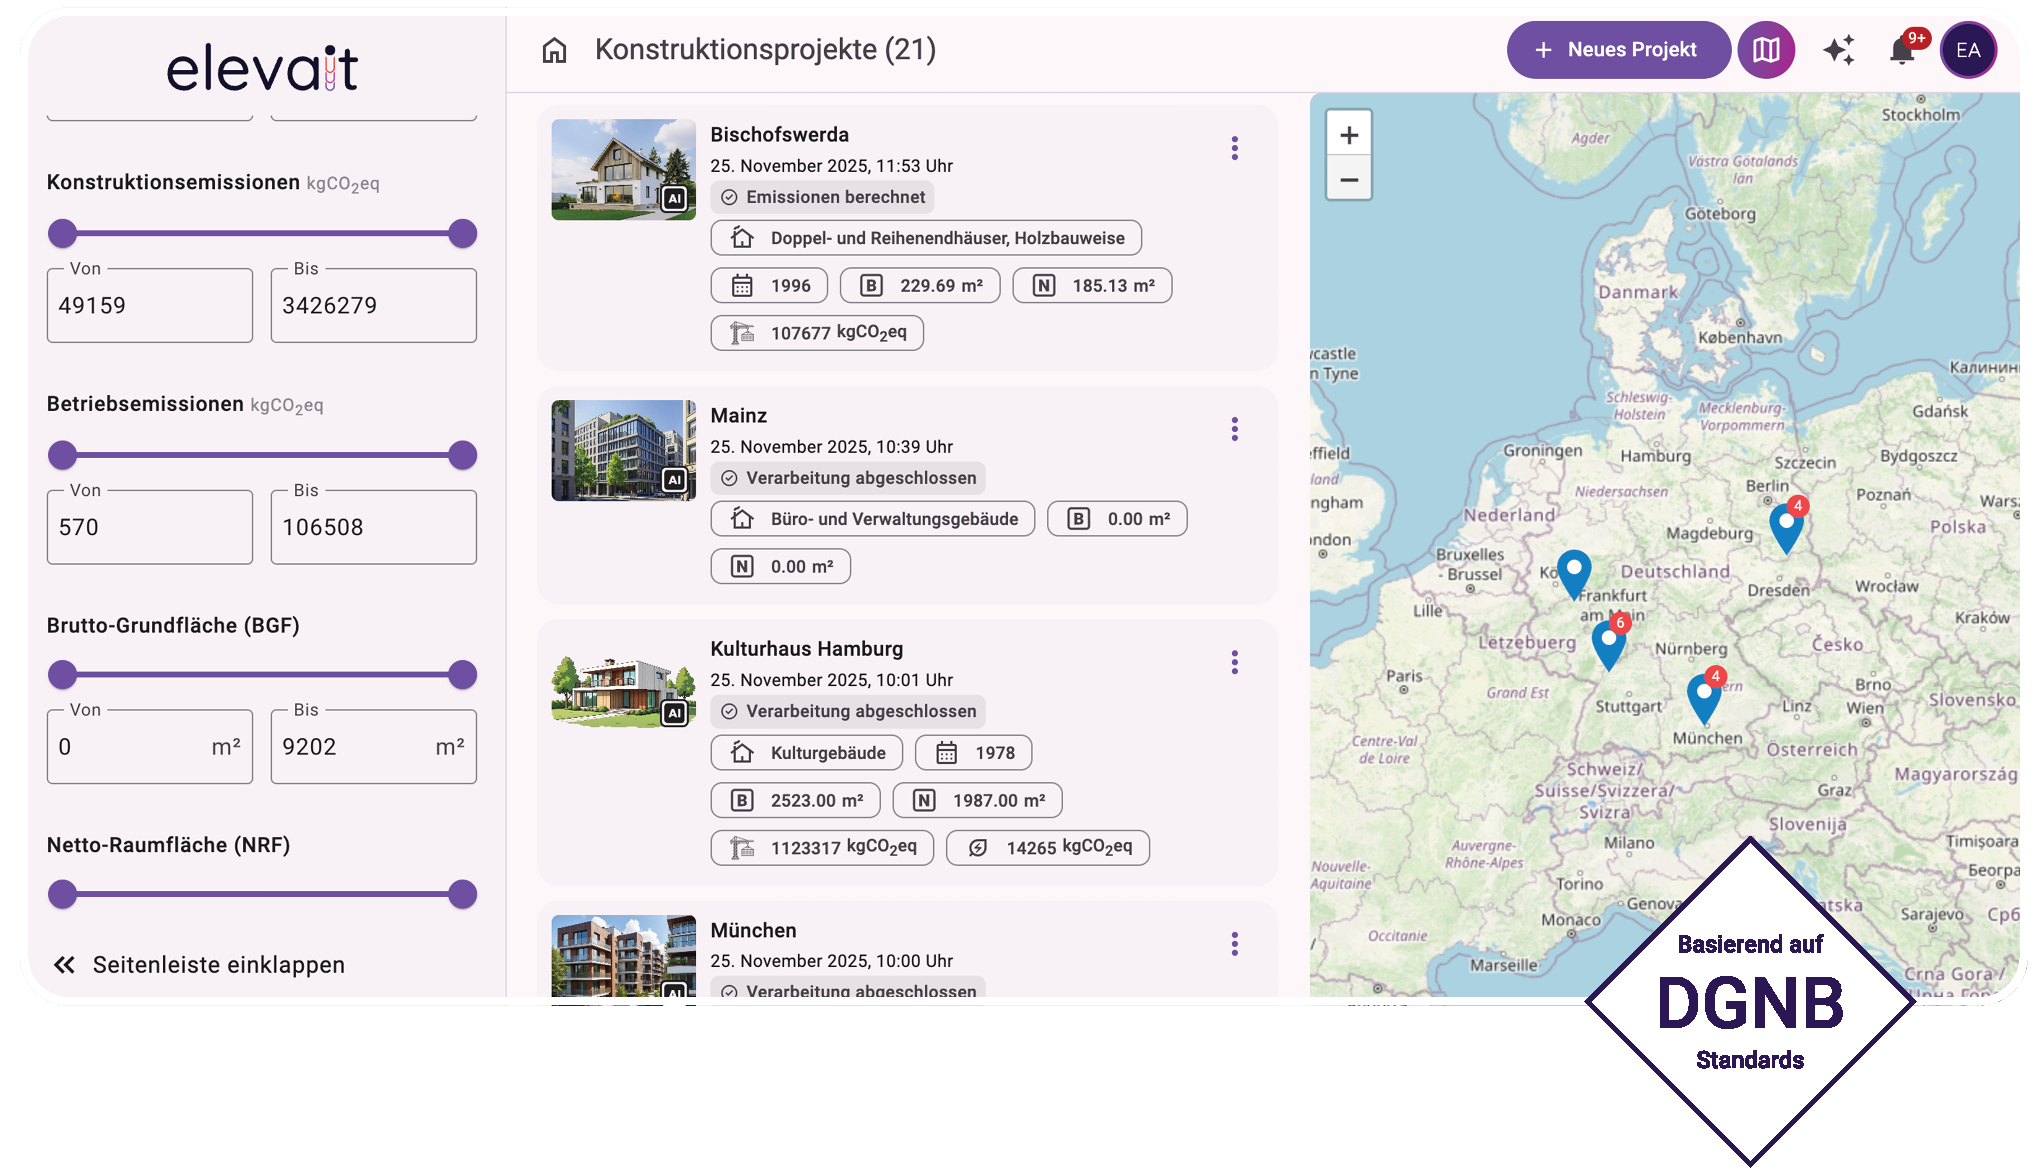
Portfolio Dashboard
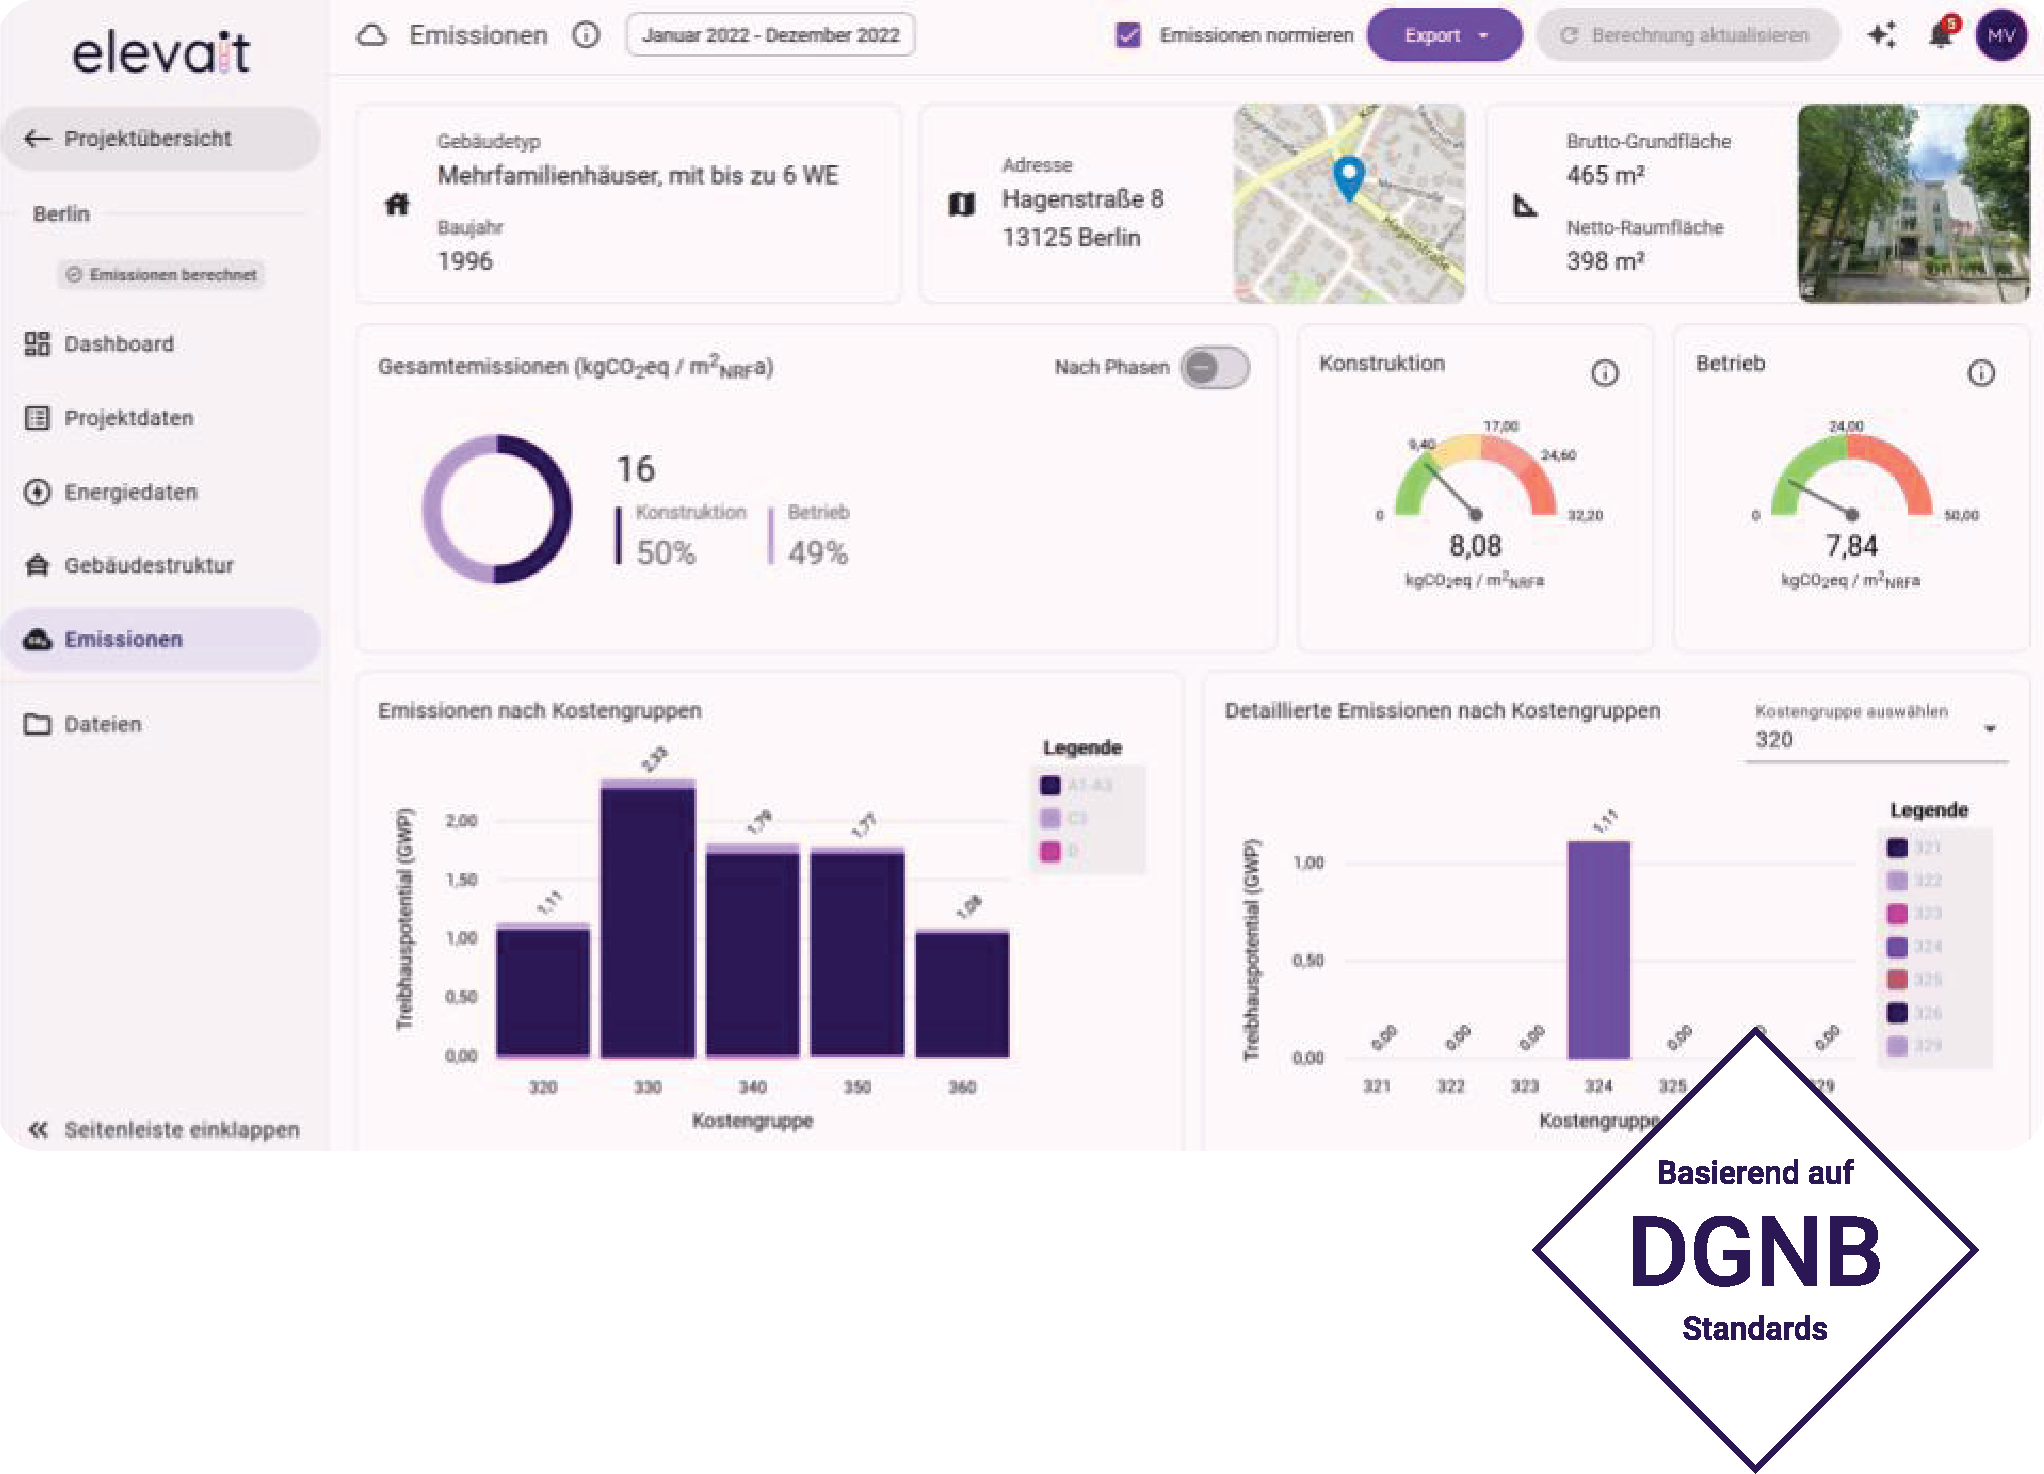
Results are displayed in an interactive dashboard featuring a map view (Google Maps), reporting charts, and filtering and sorting functions based on key metrics (e.g., kg CO2eq/m2 NRFa).
Analyze & Export
High-emission buildings are identified. Results can be exported as DGNB-compliant Excel files and CSV lists of components for further detailed analysis.


BIM World 2026
We will be there together with Hitzler Ingenieure to provide insights into our solution portfolio.
Nov 24 - Nov 25 | ICM Munich
BIM World 2026
We will be there together with Hitzler Ingenieure to provide insights into our solution portfolio.
Nov 24 - Nov 25 | ICM Munich

.svg)